- >>
- INDIA

In moving through the tumultuous path of history it is the state’s responsibility to ensure that most people (if not all) stand on the same page of prosperity and decline. The recently published World Inequality Report, 2022 however speaks differently. Published by World Inequality Lab, it highlights the current scenario of inequality in several dimensions and presents the most current synthesis of international research efforts to track inequalities worldwide.
At the outset it is crucial to understand the silver lining that lies between the concepts of income and wealth. Income refers to money received or earned continuously, in return for work or investments and generated relatively immediately, while wealth is money or valuable possessions accumulated by a person in the course of their life and generated over a longer period.
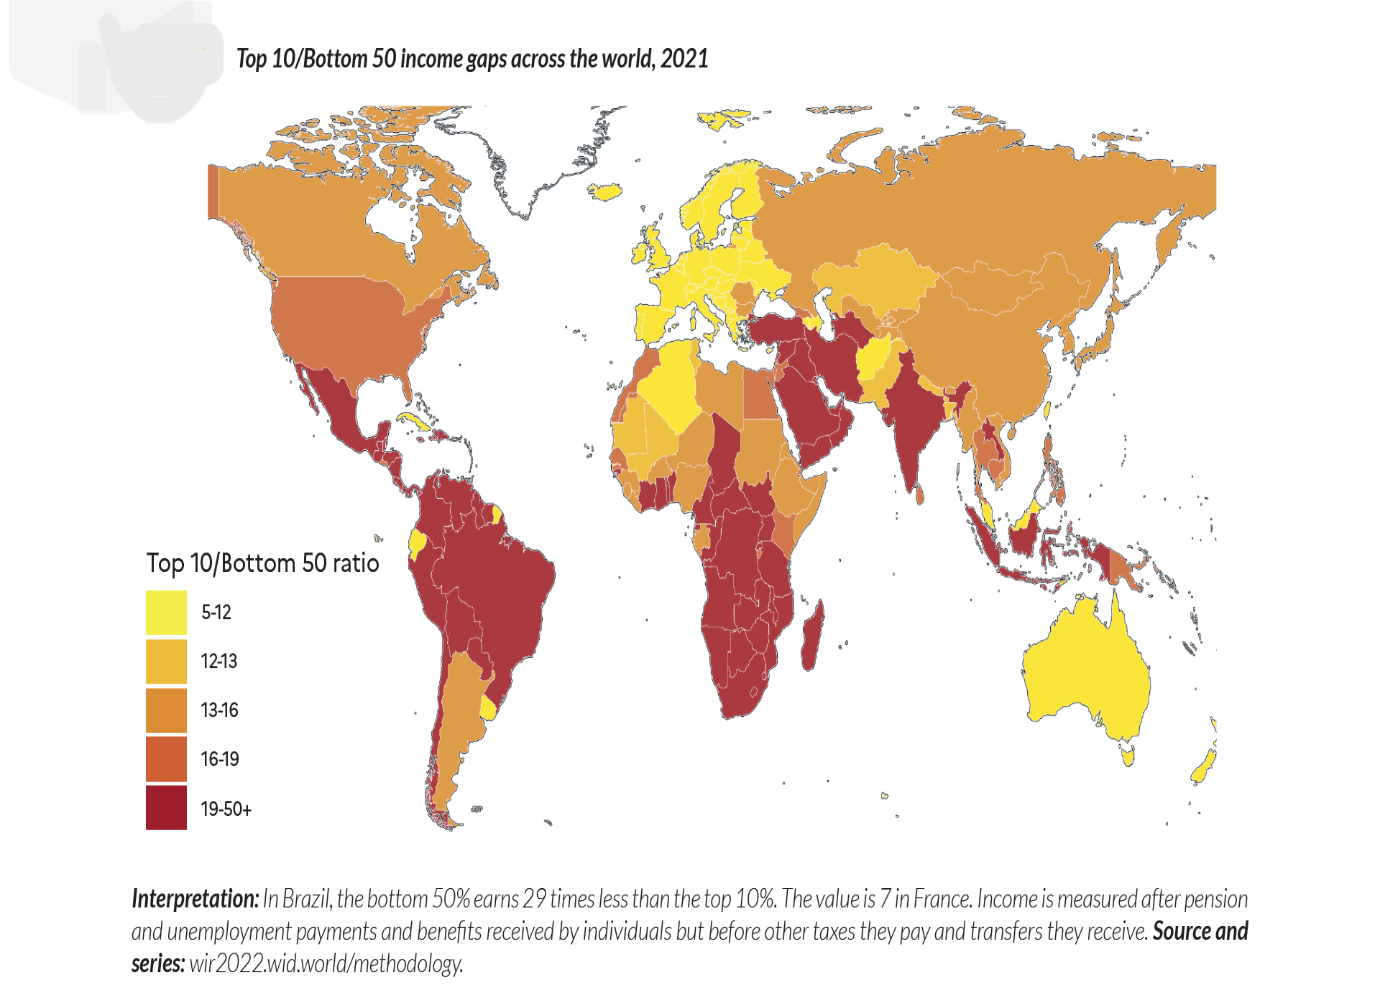
On the global level, the report highlights that over time inequality has worsened. The income gaps presented as a ratio between the top 10 vs the bottom 50 show the earnings of the top 10% as a multiple of the earnings of the bottom 50%. On a historical timeline, the value of this ratio seems to have increased, with values of 18x, 41x and 53x in the years 1820, 1910 and 1980 respectively. And from the figure below, it is evident that India comes in at the lowest rank in terms of income disparity.
The case of income inequality in India is very precarious indeed. Here the average income of an adult is INR 2.04 lakhs a year, and these estimates suffer from the problem of including extreme observations. Specifically, the top 10% earn INR 11.17 lakh which is over 20 times higher than the bottom 10% who earn INR 53,160.
Precarity increases as estimates of the top 1% and middle 40% are brought in. The report indicates that the middle 40% manage to hold 30% of income while the top 1% hold 22%. Thus, in income generation terms, India is a country of poor and structurally unequal classes where an affluent class of elites also manages to exist.
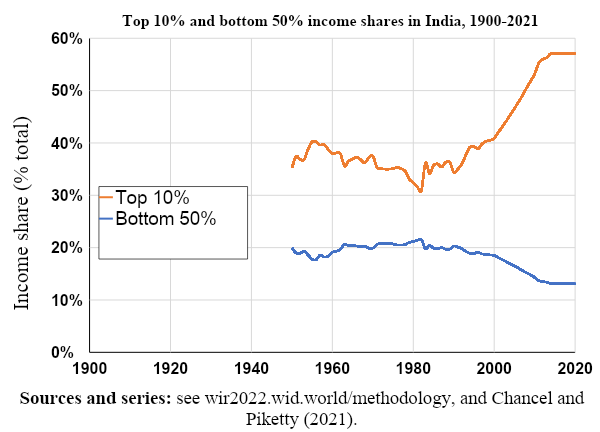
Looking toward a historical perspective (figure below) it is observed that the gaps between the share of the top 10% and the bottom 50% were the lowest between 1950-82, wherein it was 16 points in 1950 and the lowest in 1982 i.e. 9 points. The next lowest contribution by the top 10% was in 1991 (35%) which has further increased in the post reforms period.
In a surprisingly unfortunate manner, the share held by the lower 50% has constantly been falling in the period after economic reforms. And the gap continues to grow.
The state of wealth inequality is even more worrisome in the nation. The report highlights that while the average household possessed wealth worth INR 9.83 lakhs the bottom 50% own an average of INR 66,280 only, which amounts to nothing.
The middle class stands relatively poor with an average wealth of only INR 7.24 lakhs as compared with the top 10% and 1% who own INR 63.5 lakhs and INR 32.4 lakhs respectively.
Moreover, the bottom 50% hold only 6% of total wealth while the top 10% hold two-thirds of it or 64%. Historically, the possession, accumulation and distribution of wealth have been skewed in the favour of the rich which indicates an absolute failure of fiscal planning.
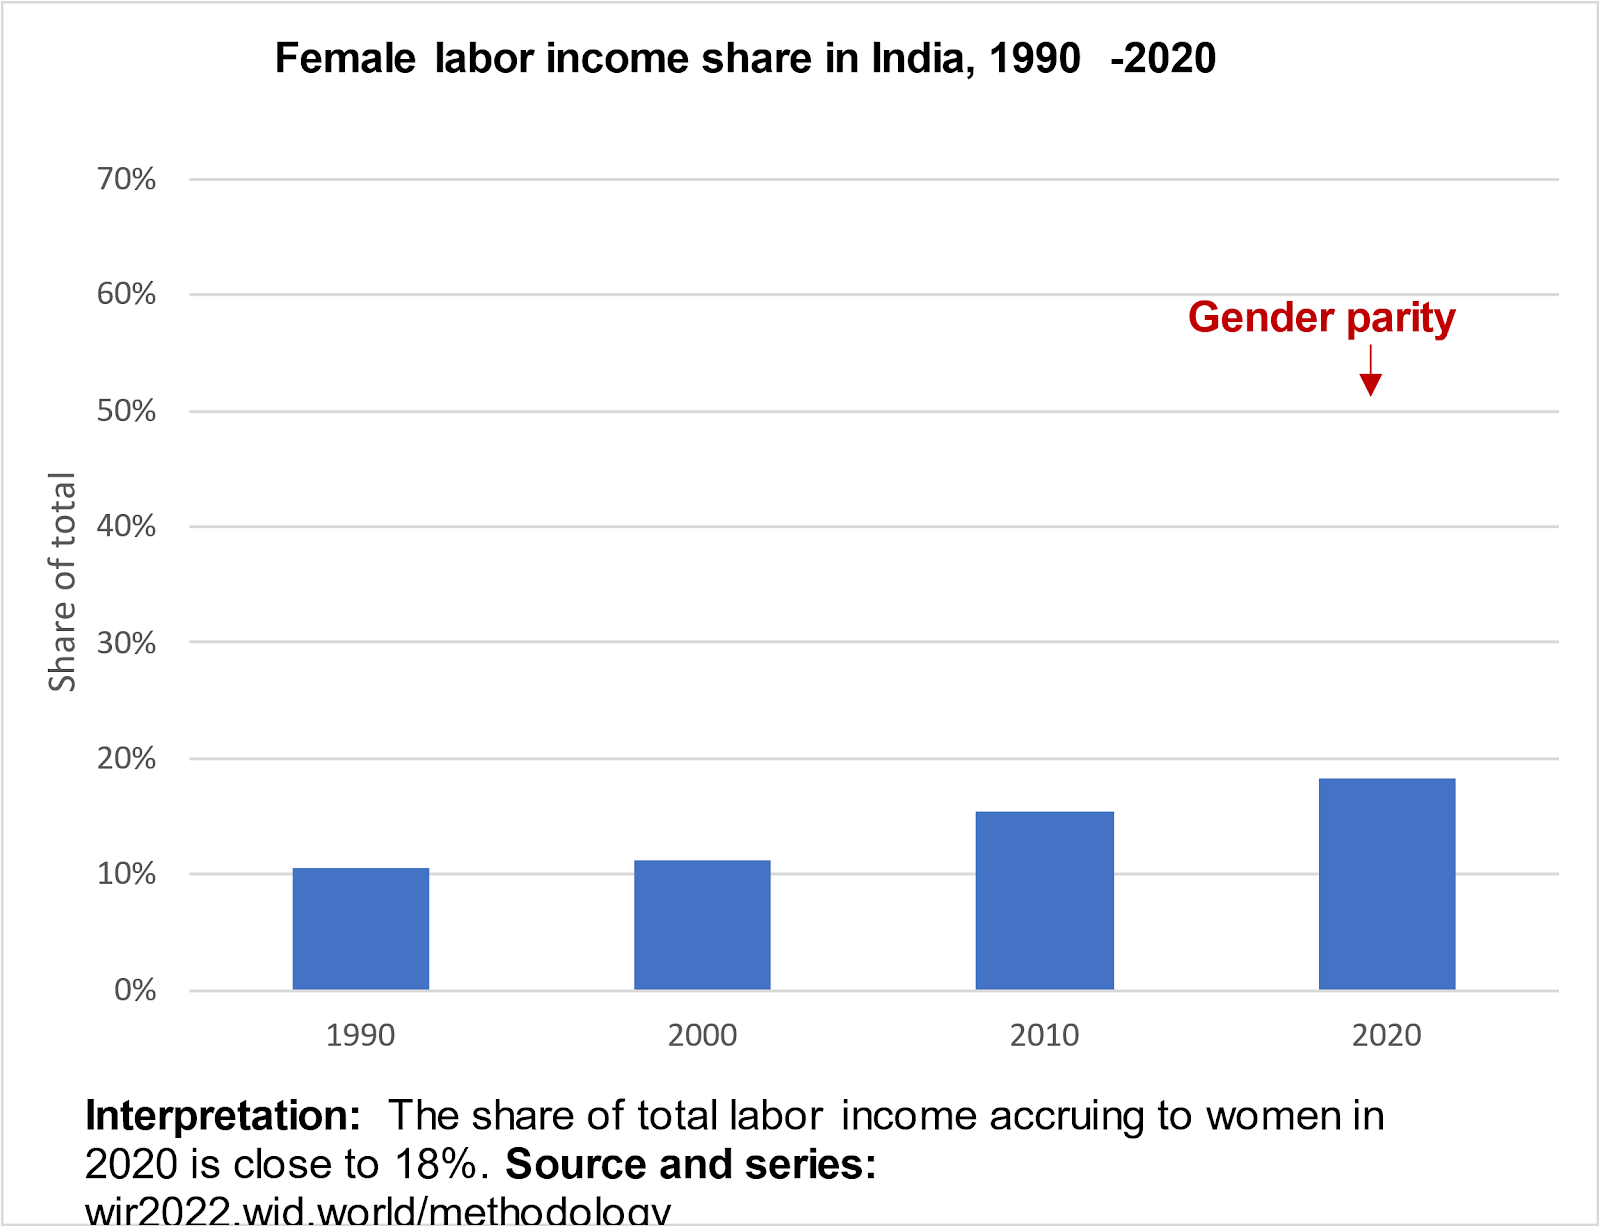
The case of gender inequality is even worse as women’s share of labour income totals only 18%, which is lower than the Asian average (excluding China) of 21%. Though historically there has been a significant increase from 10% in 1990 to 18% in 2020, this increment fails to reach the regional average, let alone touching the level of parity of 50% or redress at a level much higher.
Moreover, the significant reforms that have been brought into the economic and social infrastructure of the nation don’t seem to have had the slightest impact on the path of growth in terms of female share in labour income, implying that modernisation and globalisation may have increased female participation in the labour force but have simultaneously created job losses for other women, neutralising the contribution of reforms to women’s share of labour income.
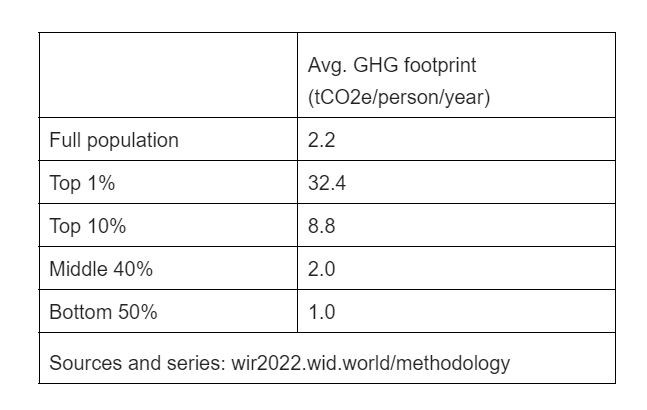
Finally, although India has been a low emitter of greenhouse gases with low average emissions of 2 tonnes of CO2 equivalent, a huge disparity is evident in the percentage contribution. Here the top 1% contributes 32% while the top 10% contributes a 9% equivalent. Against this, the middle 40% and bottom 50% contribute only 2% and 1% respectively.
In recent years, the quality of inequality data shared by the government with the public has seriously deteriorated, making it particularly difficult to assess recent inequality changes. Moreover, there has been resistance to acting against such gross disparities. These estimates not only demonstrate the precariousness of the inequality situation in India, they also sound the alarm for immediate political actions to bring everyone on the same page.
Kaibalyapati Mishra is junior research fellow, Centre for Economic Studies and Policy, ISEC Bangalore