- >>
- INDIA
Poverty Beyond Data
There is too much focus on simplified statistics rather than comprehensive well being

The use of large datasets for making economic policy is being increasingly advocated in India, with a push from government agencies to collect and use such data to implement welfare programs, ascertain their impact, and measure economic progress.
While this approach brings essential elements of objectivity and transparency to policy making, it should not rob us of subjective insights that come from other forms of human understanding. These qualitative insights cannot be derived from quantifiable data.
One pertinent question is of measuring well being. Poverty is measured in India using data recorded in surveys of millions of households. These data have only a few dimensions. The income or expenditure they measure is not meaningful without a context, for instance of public goods and services provision.
Income measures cannot tell us much about the ability of a ‘non-poor’ household to pay for commercial medical care in an emergency. They don’t describe whether individuals live with dignity within a household, or the inequities within families. Often, wealth-poor households must make tradeoffs, for example between paying to educate a child or building a pucca house with a government subsidy.
Standard poverty measures tend to dehumanise every poor household into a statistic, ignoring family histories, big decisions and a family’s way of life. Large-scale survey measures of wealth must also be standardised across the population, requiring several simplifications.
“The NSSO survey considers assets purchased more than one year ago to have no current value, and with the current definition of household size, a household can be suddenly 33% worse off for having a baby that they probably wanted,” says Jeff Hammer, the economist behind One Hundred Homes, a visual survey of India.
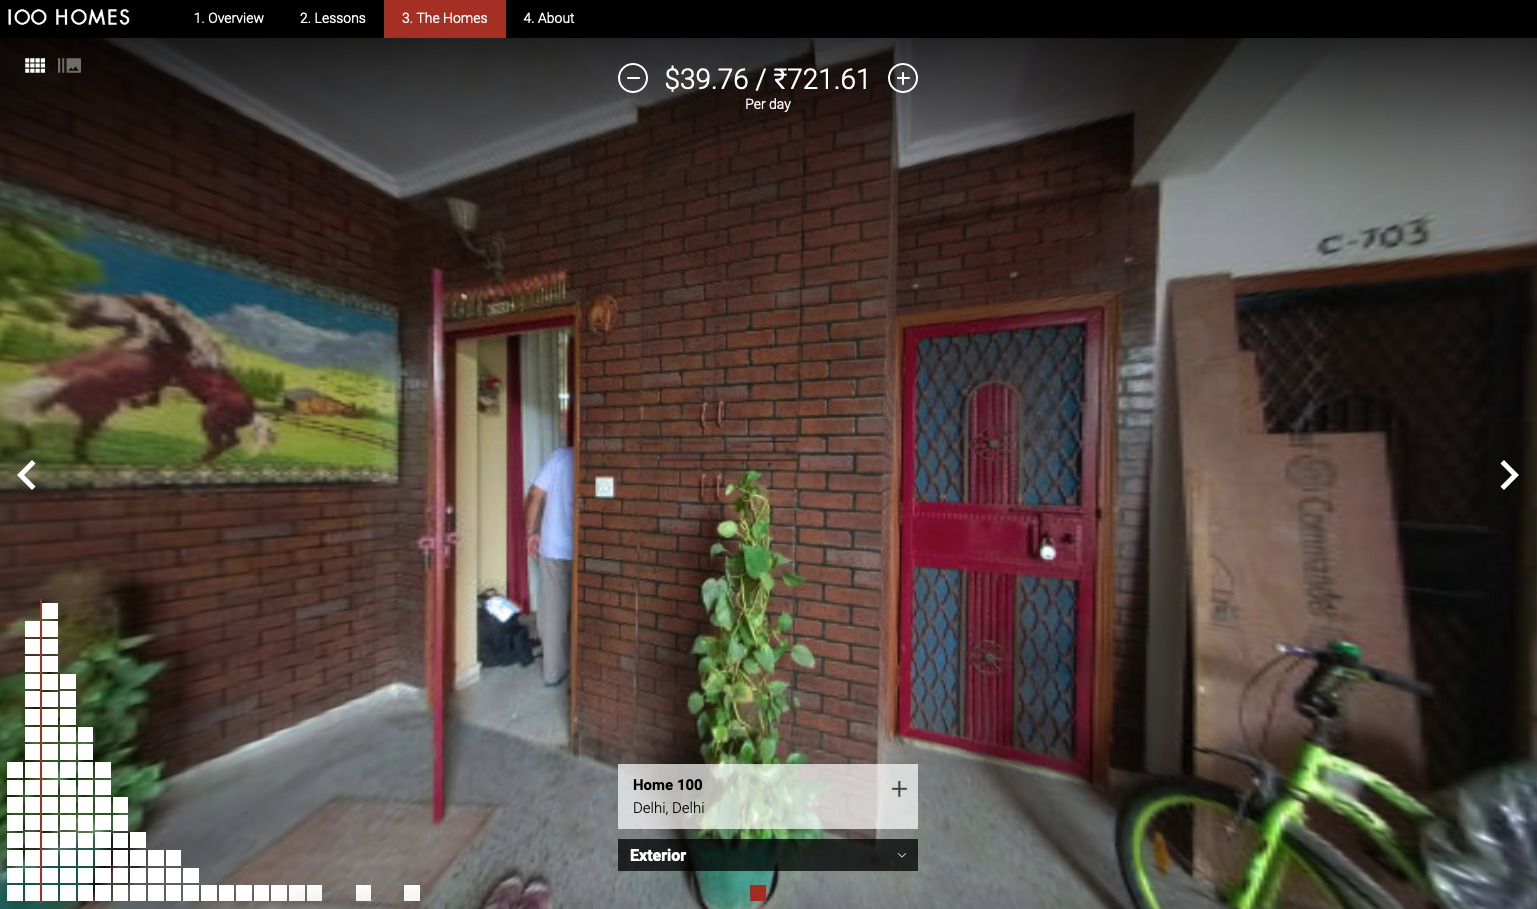
The multidisciplinary team behind this project assembled a combination of expenditure data, photographs, 360-degree media, and documentary footage of one hundred homes in India, sampling from the percentiles of per-capita consumption from India’s wealth distribution as measured in the Indian Human Development Survey, a representative survey of 41,000 households conducted by the University of Maryland and the National Council of Applied Economic Research in New Delhi.
A quiz on the website asks you to choose the wealthier household from a pair of pictures. The test demonstrates the arbitrariness of any poverty line, with households below it being indistinguishable from those just above it. From the policymaker’s standpoint, depending on the wealth distribution, a small change in official poverty lines could suddenly reclassify millions of these largely identical households as poor – or not poor.
There is also a lot of information that conventional economic surveys do not quantify but photographs capture. “Something as innocuous as where families keep toothbrushes varies a lot across households and can tell us a lot,” says Evan Wexler, journalist and director for One Hundred Homes. A room in a household is often used for a variety of purposes over the course of the day. Differences in the personal belongings of men and women speak to the gender disparity in a household. Being able to visualise the relationship between income and a family’s kitchen or bathroom helps make meaning of poverty and inequality.
The richest household documented by Hammer’s team, analogous to the top 1% of India’s income distribution, belongs to what we colloquially label “the middle class”.
This household earns Rs 721 a day, or roughly 2.63 lakhs a year.
The researchers behind the One Hundred Homes project also emphasise that India is much poorer than other countries: adjusting for prices, if India adopted the poverty line used in the United States, 97% of Indians would be deemed in poverty.
In the pictures, it is towards this high end of the distribution that the differences from household to household become much larger and easily visible to us, as opposed to the incremental differences between households earning lower incomes.
Another attempt at measuring well-being is the United Nations’ World Happiness Report, which uses data from surveys about life evaluations to measure a country’s socio-economic development.
The Happiness Report’s measure of life evaluation is the Cantril Ladder, which asks people to imagine themselves standing on a ladder with steps between 0 and 10, where 0 is the worst possible life for them and 10 the best possible life for them.
For Indians the average life evaluation is low at 3.57 – and India ranks 144 among 153 countries.
The study also uses a model to explain how life evaluations relate to GDP per capita, social support, healthy life expectancy, freedom, generosity, and the perceived absence of corruption.
New and alternative measures of economic development cannot be expected to replace traditional income-based measures, which have persisted over time because they are easy to capture, and can be compared over time and across distances. But alternative measures such as those described above can complement traditional metrics, keeping us from abstracting away from reality by focusing on a single statistic in the absence of context.
Shivangi Mittal is an associate at Koan Advisory and Megha Patnaik is a fellow at the Esya Centre